matplotlib系列(2)-- 多子图绘制功能
在matplotlib下,一个画布(Figure)对象可以包含多个子图(Axes),可以使用subplot()快速绘制。
1、subplot介绍
1 | subplot(numRows, numCols, plotNum) |
图表的整个绘图区域被分成numRows行和numCols列,plotNum参数指定创建的Axes对象所在的区域。
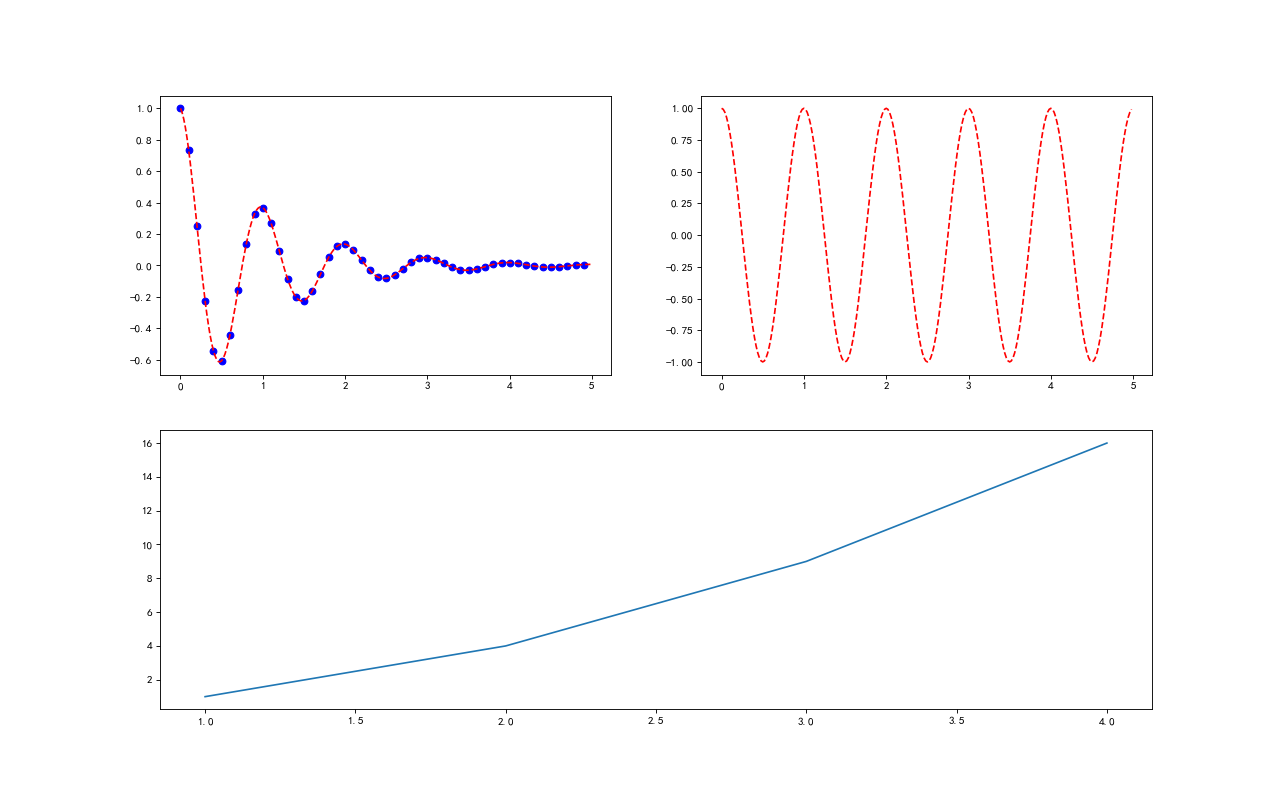
2、subplot应用举例
1 | import matplotlib.pyplot as plt |
在matplotlib下,一个画布(Figure)对象可以包含多个子图(Axes),可以使用subplot()快速绘制。
1 | subplot(numRows, numCols, plotNum) |
图表的整个绘图区域被分成numRows行和numCols列,plotNum参数指定创建的Axes对象所在的区域。
1 | import matplotlib.pyplot as plt |