Sklearn生成模拟数据集

随机样本生成

1
2
3
4
5
6
7
8
9
10
11
12
13
14
15
16
17
18
19
20
21
22
23
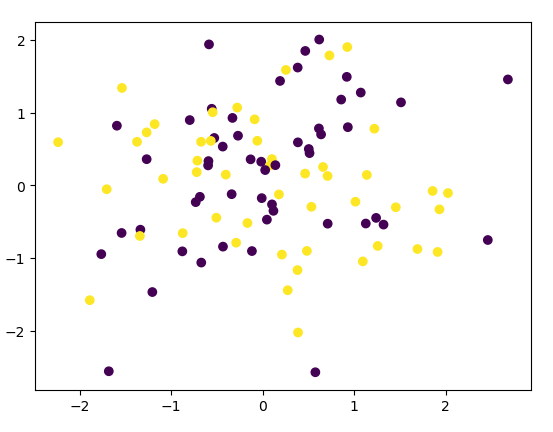
import matplotlib.pyplot as plt
from sklearn.datasets import make_classification

# make_classification
X, Y = make_classification(
n_samples=100, # 样本个数
n_features=20, # 特征个数
n_informative=2, # 多信息特征的个数
n_redundant=2, # 冗余信息,informative特征的随机线性组合
n_repeated=0, # 重复信息,随机提取n_informative和n_redundant 特征
n_classes=2, # 分类类别
n_clusters_per_class=2, # 某一个类别是由几个cluster构成的
weights=None,
flip_y=0.01,
class_sep=1.0,
hypercube=True,
shift=0.0,
scale=1.0,
shuffle=True,
random_state=None
)
plt.scatter(X[:, 0], X[:, 1], marker='o', c=Y)
plt.show()

高斯分布样本生成

1
2
3
4
5
6
7
8
9
10
11
12
13
14
15
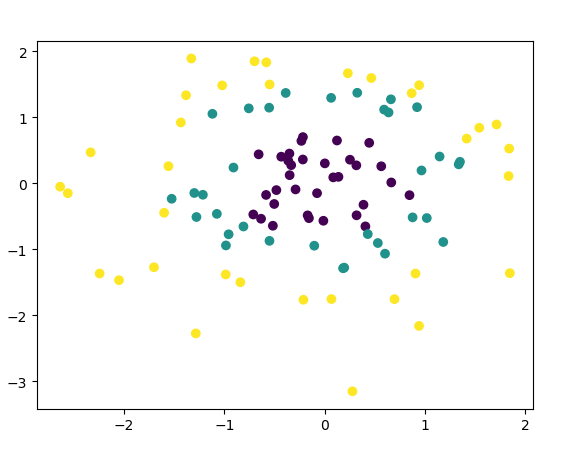
import matplotlib.pyplot as plt
from sklearn.datasets import make_gaussian_quantiles

# make_gaussian_quantiles
X, Y = make_gaussian_quantiles(
mean=None,
cov=1.0,
n_samples=100,
n_features=2,
n_classes=3,
shuffle=True,
random_state=None
)
plt.scatter(X[:, 0], X[:, 1], marker='o', c=Y)
plt.show()

环形分布样本生成

1
2
3
4
5
6
7
8
9
10
11
12
13
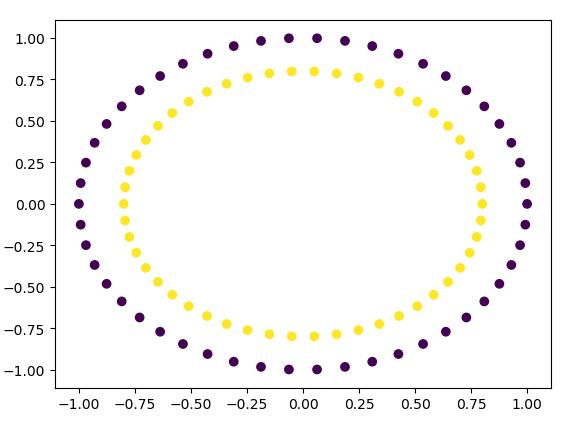
import matplotlib.pyplot as plt
from sklearn.datasets import make_circles

# make_classification
X, Y = make_circles(
n_samples=100,
shuffle=True,
noise=None,
random_state=None,
factor=0.8 # factor :外圈与内圈的尺度因子<1
)
plt.scatter(X[:, 0], X[:, 1], marker='o', c=Y)
plt.show()

半环形分布样本生成

1
2
3
4
5
6
7
8
9
10
11
12
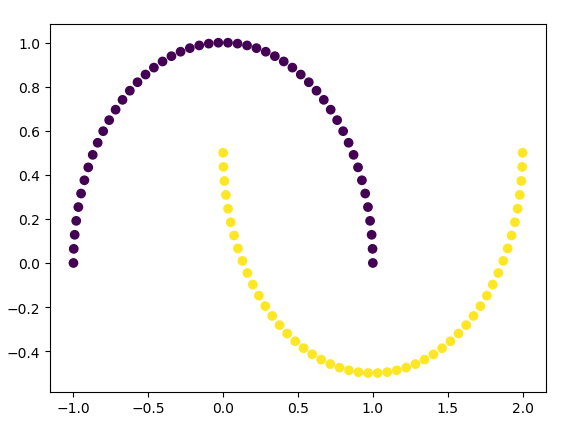
import matplotlib.pyplot as plt
from sklearn.datasets import make_moons

# make_classification
X, Y = make_moons(
n_samples=100,
shuffle=True,
noise=None,
random_state=None
)
plt.scatter(X[:, 0], X[:, 1], marker='o', c=Y)
plt.show()